
“THE VALUE OF A SHARE DEPENDS ON ITS FUTURE DIVIDENDS”
“THE VALUE OF A SHARE DEPENDS ON ITS FUTURE DIVIDENDS”
The above passage is taken from the book “Stock Market Investment in Malaysia and Singapore” by Dr. Neoh Soon Kean of Dynaquest Sdn Bhd. It was published in year 1985.
He had to mentioned it twice to show the heavy emphasis of dividend in investing. He also specifically mentioned FUTURE DIVIDENDS.
Valuing share with Dividend Discount Model (DDM)
As valuation techniques go, the dividend discount model (“DDM”) is basically a more conservative cousin of discounted cash flow analysis.
The DDM approach seeks to value a stock by using predicted dividends and discounting them back to their present value. The idea is that, when you buy stock, the only cash flow you receive directly from this investment are expected dividends. The dividend discount model builds from this to argue that the value of a stock should therefore be the present value of all its expected dividends over time.
While many analysts have moved away from the dividend discount model, arguing that its focus on dividends is too narrow, it does have the advantage of simplicity & logic. This model seems a good starting point for valuing stocks, since it sensibly connects dividend payments and growth to the stock price. Dividends after all represent the only cash flow from the firm that is tangible to investors. Ideas like free cash flows (FCF) are most abstract and prudent investors may legitimately argue that they cannot lay claim to these cash flows. Another key advantage is that there are only a few assumptions involved, whereas deriving forecasted free cash flow involves estimates of capex, depreciation and working capital.
Variables in DDM
Similar to DCF, DDM has similar variables in the calculation. We will go through each of the variables below:
- Start Value – Dividend PerShare
- Dividend Growth Rate
- Discount Rate
- Adjusting Numbers – Debt & Cash
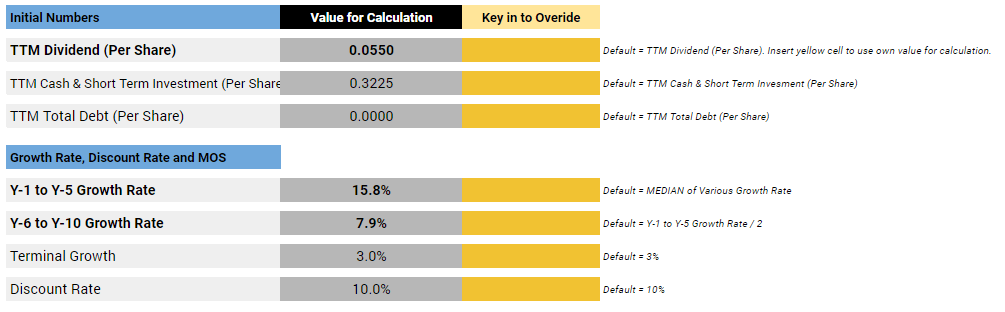
Start Value – Dividend PerShare
The starting value for DDM is the trailing 12 months’ dividend per share. This figure is automatically filled for the DDM calculation. However, should there be any special dividend that has been given out due to one off event such as disposal of asset or subsidiary or bumper earning, you may adjust the dividend pershare accordingly.
Dividend Growth Rate
In the analyzer, DDM valuation is also a THREE STAGE DDM Valuation. You will have 3 growth rate – first 5 years (Y1 – Y5) growth rate, next 5 years (Y6 – Y10) growth rate and terminal growth rate.
Similar to DCF, the growth rate is calculated in the “Growth Rate” tab by calculating the median growth rate of several important financial figures. The growth rate will be used in the first 5 years (Y1 – Y5) growth rate. The analyzer assume that the growth rate will slow down on the next 5 years (Y6 – Y10), so the growth rate will be half of the first 5 years (Y1 – Y5) growth rate. Both the growth rate figure can be customized with your own figure by keying in the respective yellow cells.
Since it isn’t practical to forecast cash flows for an infinite number of years, it’s usual to end the DDM with a terminal value. We will need to determine the third growth rate which is the terminal growth rate. This is the growth rate for the cash flow from year 10 onward. Usually the best practise it to put the growth rate at inflation rate.
By default, it is set at 3% and should you require to change it, just key in the figure at the yellow cell.
Discount Rate
Similar to DCF, the discount rate is set based on the “Quality” star. Considering that the “average” market return is about 8-12%, a minimum discount rate should be set to 8%. We would use 8% as a minimum for stable and predictable companies such as NESTLE while 12% is a good return for less predictable companies.
The discount rate is set to 9% for Quality stars ≥ 4 or 10% for Quality stars < 4.
Adjusting Numbers – Debt & Cash
Once we have determined the start value, growth rate and discount rate, we can start the DDM calculation. With TRV Stock Analyzer, the calculation is automated.
To calculate the present value of the stock, we add up each year dividend after considering growth and the terminal dividend. We then discount it back to present value. Present value is then divided by basic share outstanding to get the present value per share.
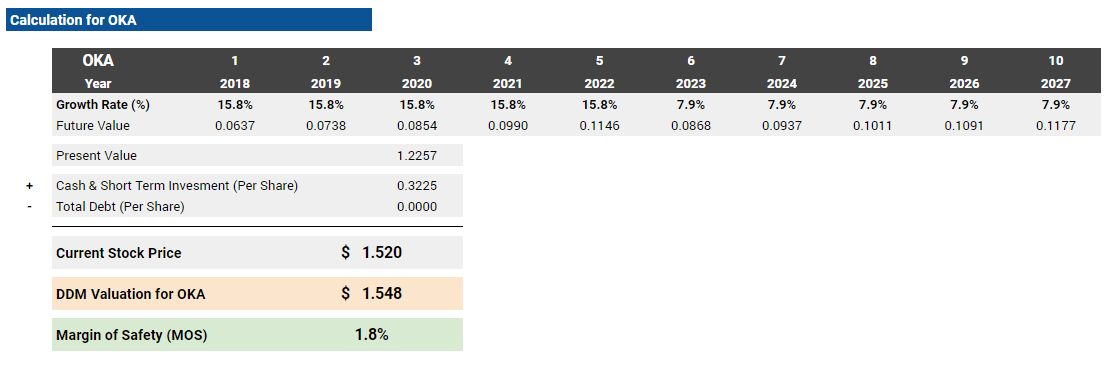
From the picture above, we calculated the present value of the stock is at 1.2257 per share.
To get the final DDM valuation for the stock, we will have to add back the cash & short term investment and also deduct the debt for the company.
With that, we have completed the stock valuation using DDM valuation model with a valuation of 1.548.
The margin of safety for the valuation is also calculated. In general, we usually aim to have a 30% margin on safety before making the investment. Never forget a good margin of safety. The best of us get it wrong as well.
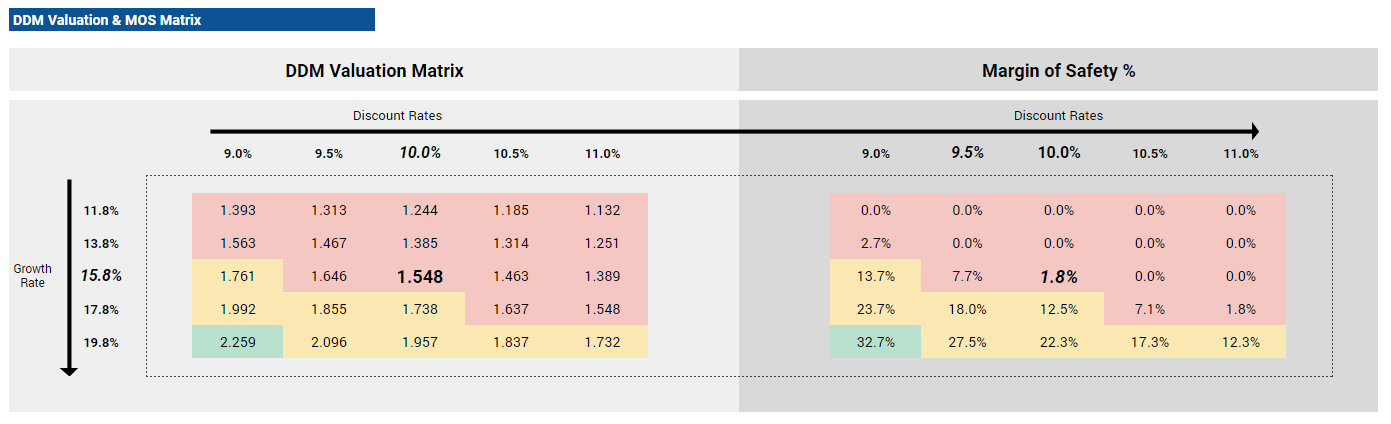
Similar to DCF valuation, the sensitivity matrix for DDM is also calculated.
What if the Stock doesn’t pay Dividends?
Of course, one issue is that many companies don’t pay a dividend, choosing to retain all of their earnings so they can grow. The conventional wisdom is that the dividend discount model cannot be used in this situation. However, this is not always the case – a non-dividend paying company can still be valued based upon dividends that it is expected to pay out when the growth rate declines. Consider an investor with a required return of 7% looking at a stock that is not expected to pay dividends for the next five years, but that will pay dividend in year six and the dividend is expected to grow 5% annually thereafter. All that needs to be done is to compute the DDM value at year 5, then discount it back for five years.
Conclusion
While the dividend discount model is fairly old-school, it can still be surprisingly useful. DDM counts only those cash flows that are actually paid out, hence, it is a conservative “intrinsic value” model.
![[User Guide] TRV Stock Analyzer Overview](https://trvanalyzer.com/wp-content/uploads/2017/09/Tutorial-Header-Overview-Tabs-500x383.png)
![[User Guide] “Home” Tab](https://trvanalyzer.com/wp-content/uploads/2017/09/Tutorial-Header-Home-Tab-500x383.png)
![[User Guide] “F-Dashboard” Tab](https://trvanalyzer.com/wp-content/uploads/2017/09/Tutorial-Header-F-Dashboard-500x383.png)

Leave A Comment