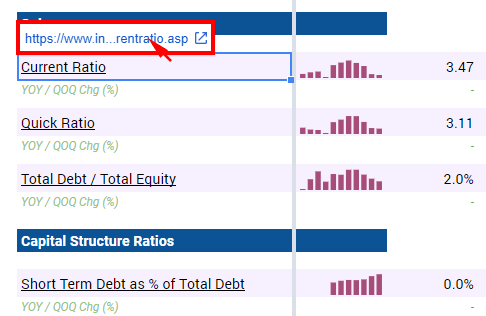
“Ratio” tab as the name suggest will show you more than 100 commonly used financial ratios. Each ratio is calculated for last 15 financial years, trailing twelve months (TTM) and also using current stock price (for valuation ratio).
Generally, the ratios tab can be broken down into 9 parts:
- Margins – Calculation of profit margins
- Return of Capital – Calculation of ROE, ROIC of the business
- Valuation Ratios – Calculation of various type of valuation ratios
- Cash Flow Ratios – Ratios that look in to cash flow of the business – OCF & FCF
- Efficiency – Calculation of cash conversion cycle
- Solvency – Ratios to look into liquidity and solvency of the business
- Capital Structure Ratios – Ratios to look into debt of the business
- PerShare Items – Important financial figures divided by number of shares
- Growth rate – Calculation of sustainable growth rate
Most of the ratios used in the analyzer are commonly used ratios. The definition and interpretations are in the link attached to the name. You may also click on the link attached to the name to read more about the particular ratio.
Should you require any further explanation, do feel free to send us an e-mail.
Min, Median and Max
On the far right of the sheet, there is minimum, median and maximum figure calculated for each ratio.
Minimum – Lowest figure for the ratio
Median – Midpoint figure for the ratio
Maximum – Highest figure for the ratio
These serves as a good comparison and guides when compare to the current figure.
You may also change the Median calculation to different time line – 3FY, 5FY and 10FY.


![[User Guide] TRV Stock Analyzer Overview](https://trvanalyzer.com/wp-content/uploads/2017/09/Tutorial-Header-Overview-Tabs-500x383.png)
![[User Guide] “Home” Tab](https://trvanalyzer.com/wp-content/uploads/2017/09/Tutorial-Header-Home-Tab-500x383.png)
![[User Guide] “F-Dashboard” Tab](https://trvanalyzer.com/wp-content/uploads/2017/09/Tutorial-Header-F-Dashboard-500x383.png)

Leave A Comment