In the “Chart” tab we put the financial figures in interactive charts to have better visualization. A chart is a better way to see the performance trends compared to pure numbers.
There are a total of 5 charts in this tab.
1. Income Statement – Revenue, Profit & Margins
The second chart will show you the important figures from the income statement – the top line, bottom line and the margin.
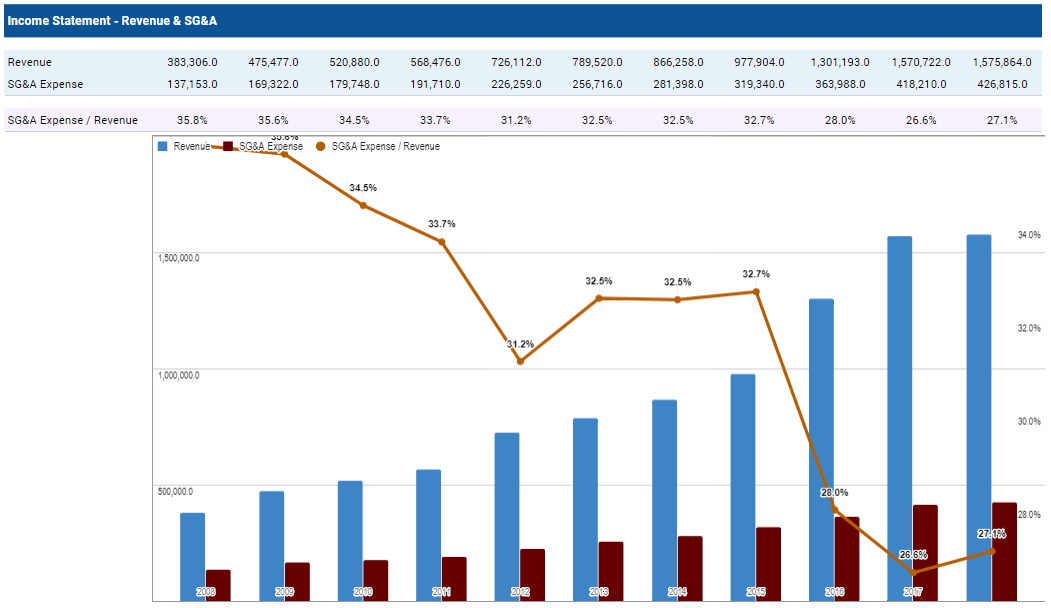
2. Income Statement – Revenue & SG&A
The third chart will examine the growth / decline in revenue vs the operating expenses.
3. Cash Flow Statement – OCF, CAPEX & FCF
The fourth chart shows the cash flow generation vs Capex spending and the balance in FCF.
4. Balance Sheet – Equity, Cash & Debt
The fifth chart will show the liquidity and debt structure of the company.
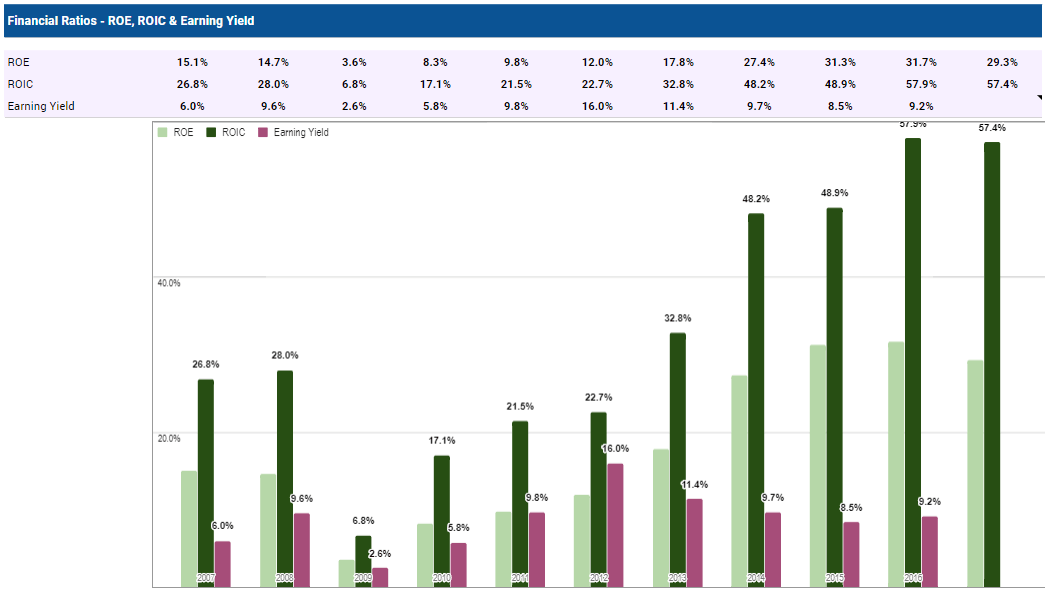
5. Financial Ratios – ROE, ROIC & Earning Yield
The sixth chart will show the efficiency via ROE and ROIC and the valuation of the company in term of earning’s yield.


![[User Guide] TRV Stock Analyzer Overview](https://trvanalyzer.com/wp-content/uploads/2017/09/Tutorial-Header-Overview-Tabs-500x383.png)
![[User Guide] “Home” Tab](https://trvanalyzer.com/wp-content/uploads/2017/09/Tutorial-Header-Home-Tab-500x383.png)
![[User Guide] “F-Dashboard” Tab](https://trvanalyzer.com/wp-content/uploads/2017/09/Tutorial-Header-F-Dashboard-500x383.png)

i am wondering if u can present a chart in EBIT/EV Vs Ebit growth percentage format?
Hi Boon,
EBIT/EV is presented as Earning Yield in the last chart.
With the analyzer, you can actually customized the data according to your needs. If you are interested to have a chart of EBIT/EV vs. EBIT percentage growth, you can add a new tab and add a chart and point it to the data point in the respective tab. The data will change when you load another new stock.
That is the beauty of it. You can build it to your own preference. Should you need any help, feel free to contact us! We are glad to help.
🙂