Before we dive into each of the valuation models, we take a look at the “V – Dashboard” tab. The valuation dashboard tab serves as a summary for all the valuation method and also for the calculation of median fair value and its margin of safety.
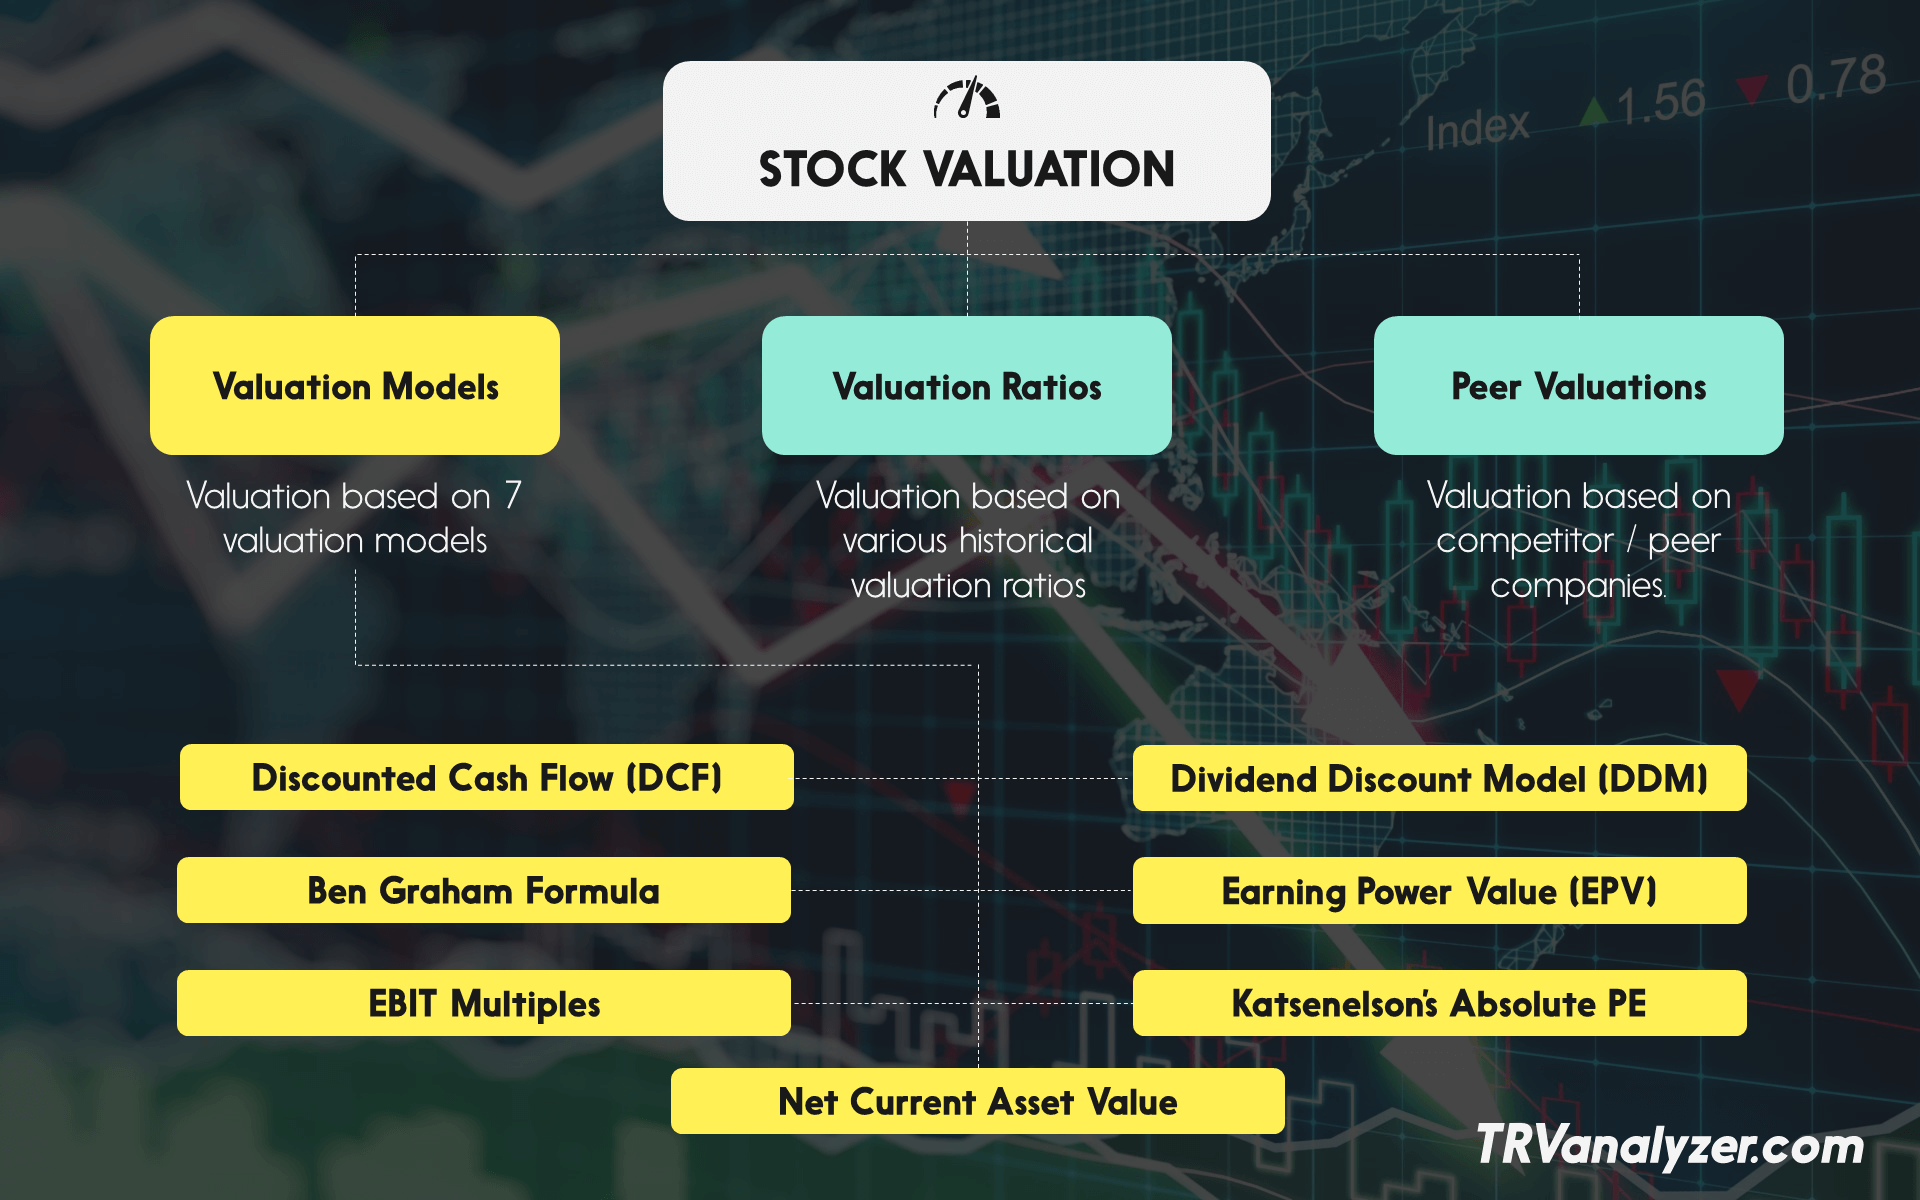
All the valuation method available in the analyzer is listed in the picture below:
On the top of the “V – Dashboard” page, the current stock price, median fair value and the margin of safety is calculated. Median fair value is calculated based on each fair value generated from valuation models, valuation ratios and peer valuation.
Median is the middle number of the set of fair values. Median is preferred over simple average as it takes care of the outliers.
Read more about median at these link below:
- https://www.investopedia.com/terms/m/median.asp
- http://www.darwinsfinance.com/median-mean-definition
We will explain how the median fair value is derived toward the end of this article.
Part #1 – Valuation Models
Part 1 is the summary for valuation from 7 valuation models.
The 7 valuation models available in the analyzer is as below:
- Discounted Cash Flow (DCF)
- Dividend Discount Model (DDM)
- Katsenelson’s Absolute PE
- EBIT Multiple Valuation
- Ben Graham’s Growth Formula
- Earning Power Value
- Net Current Asset Value
All the fair value calculated from the above valuation models will be shown along with its margin of safety. Median fair value from valuation models is also calculated.
You also have a choice of different scenario for the valuation models. The available scenario is Conservative, Normal and Aggressive. Changing the scenario will change the growth rate for the stock which will be use in most of the valuation models. Aggressive scenario will use a higher growth rate while the Conservative scenario will take a lower growth rate. If you think that the company may be growing fast, you may change the scenario to Aggressive. Growth rate calculation is available in the “Growth Rate” tab.
Each of the 7 valuation models have its own tab for the calculation. You may go to the tab by clicking the link in the valuation name.
We go into the details for each valuation in the next few guides.
Part #2 – Valuation Ratioss
In part 2 of the “V – Dashboard”, we look at the valuation of the stock based on its historical valuation ratios. With valuation ratios, a company’s stock price enters your investment analysis. Valuation ratios include the ever-popular price to earnings (P/E) ratio, along with price to sales (P/S), price to book (P/B), and a couple of boutique P/E variations.
Valuation is done based on several ratios which includes:
- Market Capitalization
- Price / Revenue
- Price / Earning
- Price / Book Value
- Price / Net Tangible Asset
- Dividend Yield
- Earning Yield
- Operating Cash Flow Yield
- Free Cash Flow Yield
You may click on the link to read more on each of the ratios.
These ratios are selected to cover most of the aspect for the stock which include its revenue, earnings, balance sheet, dividends and also cash flow. The 5 years historical and trailing 12 months’ figures is shown along with its highest and lowest number. By default, the valuation is done based on latest 3 years’ average figures.
Let’s look at how it is calculated in details, with a Malaysia stock – GADANG.
The financial data can be break into 4 parts. Refer picture below.
- 5 years’ financial ratios, TTM and current ratios
The historical and current financial ratios is shown for the ease of comparison and reference.
- Minimum, Average / Median and Maximum for the ratios
You may select the time line and method for the calculation. You may select 3 years or 5 years and median or average. By default, it is 3 years’ average.
- Manual input for target (If required)
Should you have a personal target for the particular ratio, you may key it in the respective yellow cells.
For example, you would want to know the target stock price for the stock when it is trading at PE of 15x, you can key in 15 in the yellow cells. The valuation will change accordingly. This method may be used as a quick and dirty way to determine the target price based on a single valuation ratio, such as PE of 15x or Dividend yield of 5%.
- Valuation
The furthest right column will show each valuation based on the respective ration and its margin of safety.
- Median fair value from valuation ratios
The median fair value for all the valuation ratios I calculated at the top along with its margin of safety.
Part #3 – Peer Valuations
In part 3 of the “V – Dashboard”, we look at the valuation of the stock based on its valuation ratios compare to the average of its peers. Valuation is done based on several ratios which includes:
- Price / Revenue
- Price / Earning
- Price / Book Value
- Price / Net Tangible Asset
- Dividend Yield
- Earning Yield
- Operating Cash Flow Yield
- Free Cash Flow Yield
The rationale for this is based off of the Law of One Price, which states that two similar assets should sell for similar prices. The intuitive nature of this method is one of the reasons it is so popular and commonly used. However, this method requires you to work out each financial ratio for each of the peer company. With the analyzer, the process is much simpler.
To start, you will need to add competitor / peer stocks in the “Competitor” tab. Click here for the detail instruction on how to do it.
For GADANG, we have loaded several other construction companies which also involve in MRT construction and a few other construction of similar market cap size. The calculation of the average of the competitor list is auto calculated and this figure will be used in the valuation.
Once the competitors are loaded in the “Competitor” tab, the average of the valuation ratios for the competitors will be shown. Valuation is calculated based on the average of the competitors.
The median for all the valuation ratios is calculated on the top.
Summary
In stock valuation, it may be difficult to determine to be exact which valuation method to be used. Hence, in the analyzer we took a sort of a catch-all method to come out with a single valuation for the stock which is what we call median fair value.
From the part 1 valuation, we are able to get 7 valuations from each valuation models. In part 2, from the valuation based on historical valuation ratios, we are able to get 9 valuations. In part 3, there are 8 valuation based on peers and competitors.
There are a total of 24 valuations result, so the question is which to choose?
Using the catch-all method, we will then calculate the MEDIAN for the stock by using the 24 valuation results that we got from each valuation method. This give rise to MEDIAN FAIR VALUE.
However, you should be reminded that this is NOT the ONLY fair value for the stock. If you are comfortable and confident by using only one valuation model, then that should give you the valuation for the stock. Sometimes, with only simple method like PE valuation or DCF valuation may be able to give you the true value for the stock as long as you know what you are doing.


![[User Guide] TRV Stock Analyzer Overview](https://trvanalyzer.com/wp-content/uploads/2017/09/Tutorial-Header-Overview-Tabs-500x383.png)
![[User Guide] “Home” Tab](https://trvanalyzer.com/wp-content/uploads/2017/09/Tutorial-Header-Home-Tab-500x383.png)
![[User Guide] “F-Dashboard” Tab](https://trvanalyzer.com/wp-content/uploads/2017/09/Tutorial-Header-F-Dashboard-500x383.png)

Leave A Comment