
“Statements” tabs as the name suggest will show you the full financial statements of the company.
The analyzer has 10 full financial years and 20 latest quarterly figures. Do take note that the financial figures are normalized for the ease of comparison. Financial statements can be broken down to 3 major financial statements. The financial statements are colour coded for ease of identification.
- Income statement (Profit & Loss) – Blue
- Cash flow statement – Purple
- Balance sheet – Green
Viewing the Statement
By default, this tab will show you the simplified financial statement. You may toggle to different view using the button on top. There are several views to suit your needs:

1. Simple View
Simple view will only show few important line items for each statement
2. Full View
Full view will show all the line items in each financial statement.

3. Full View (%)
This will show all the line items along with the vertical and horizontal common size analysis. We will discuss the common size analysis further later.

4. 15FY
15FY view will show 15 years of financial figures and 4 latest quarterly figure.
5. 10FY
This is the default view. It will show 10 years of financial figures and 4 latest quarterly figure.

6. 5FY
5FY view will show 5 years of financial figures and 4 latest quarterly figure. This is suitable for those who doesn’t want a too crowded view or for companies that have less than 5 years financial figures.
7. 20QTR
20QTR view will show all the 20 latest quarter financial figures.

Line items definition
If you are unsure about the meaning of particular line item, you may click on the name of the item and the link attached to it. It will direct you to the Investopedia page that explain the meaning and formula. If you are still unsure, do send us an email.

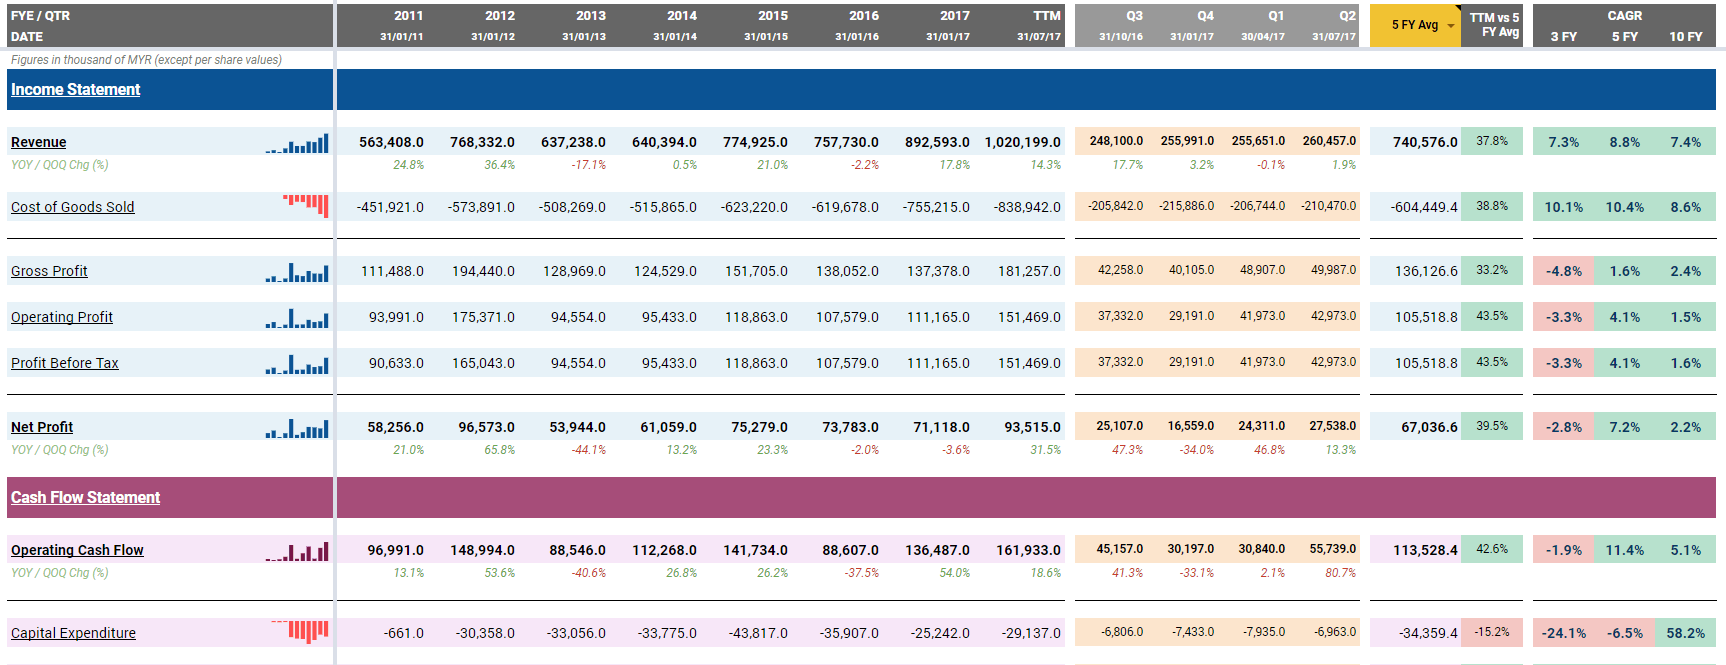
Average and CAGR
On the far left, the average and the compounded annual growth rate (GAGR) of the line item is automatically calculated.

- Drop down menu to select the options for average calculation. You may select from 3, 5 or 10 financial year average. The calculation is automatically updated.
- Difference between average and the trailing twelve months’ figure is also calculated. You will be able to see the percentage increase/decrease in TTM compare to the average.
- CAGR calculation for 3FY, 5FY and 10FY.
Common size analysis
A common-size financial statement is displays line items as a percentage of one selected or common figure.
Common size analysis can be shown by clicking on the “Full View (%)” button.

- YOY / QOQ Change (%) – This line will show the changes in percentage compared to the previous financial year or quarter
- Net Profit Margin (%) – This line is vertical common size analysis. The common item for income statement and cash flow statement is revenue while for balance sheet, the common item is total asset. In this case, the net profit is divided with revenue which will show the net profit margin.
- Net Profit Growth – This link is horizontal common size analysis. This shows the change in percentage compare to the first (oldest) financial year. In this case, year 2017 net profit of 71mil is 21.5% higher compared to 58mil in year 2008.
Read more on common size analysis:
https://www.investopedia.com/articles/investing/111413/commonsize-analysis-financial-statements.asp
![[User Guide] TRV Stock Analyzer Overview](https://trvanalyzer.com/wp-content/uploads/2017/09/Tutorial-Header-Overview-Tabs-500x383.png)
![[User Guide] “Home” Tab](https://trvanalyzer.com/wp-content/uploads/2017/09/Tutorial-Header-Home-Tab-500x383.png)
![[User Guide] “F-Dashboard” Tab](https://trvanalyzer.com/wp-content/uploads/2017/09/Tutorial-Header-F-Dashboard-500x383.png)

Leave A Comment